
One of the priority parts in the design of a Wi-Fi infrastructure for a project is to carry out a preliminary study of Wi-Fi coverage that allows predicting the behavior of the system before its implementation and installation. In this post we are going to explain how to develop a Wi-Fi coverage study.
The main objective of this study will be the verification of a correct coverage in all the areas to which it is desired to provide Wi-Fi connectivity. This will allow predicting the orientation and number of necessary equipment, as well as the capabilities of the system in each area.
The first point to take into account in the study will be the band that you want to have available or that is required in each area. From a device connectivity point of view, two Wi-Fi bands are used: 2.4 GHz and 5 GHz.
The main differences between both bands are the maximum achievable speed and the coverage range that can be obtained, that is, how far the signal can go.
| Tech Performance | 2, 4 GHz | 5 GHz |
| N. Channels | 14 non-overlapping channels | 25 non-overlapping channels |
| Maximum speed | 50/60 Mbps | 867 Mbps |
| Network Range | More range | Less range |
| Interference | More interference | Less interference |
| Standard | IEEE 802.11b, 802.11g, 802.11n (B, G y N) |
IEEE 802.11a, 802.11n, 802.11ac (A, N, AC) |
The first point to consider when implementing a Wi-Fi infrastructure is the use of channels that are as congested as possible. In the case of wanting to fix the channels manually, it is convenient to carry out a previous analysis of the spectrum to see the possible current emissions of each channel. If an automatic channel selection is configured, each access point will adapt the channel, optimizing its operation, but in areas of high interference, an automation of the connection channel can cause continuous frequency changes, which could affect the connectivity of the users that at a given time were connected to the access point.
The main reason for a greater possibility of interference in the 2.4 GHz band, in addition to having fewer bands available, is that as it has been used for longer, there are a greater number of types of devices that work in that band exclusively.
In contrast, the 5 GHz band, although it allows better speeds and is subject to less influence of interference, has a greater problem in overcoming obstacles such as walls or furniture, its range being often conditioned by the attenuation that occurs in the signal due to this attenuation.
In order to take advantage of the maximum benefits of both bands and adapt the current use based on mobility, modern dual band equipment allows configuring an automatic alternation of connection between both bands, making the connection to the band that allows better communication in each moment.
It is for this reason that if we use dual band equipment (that have 2.4 GHz and 5 GHz) it is appropriate to carry out a study for each band. In the following images you can see the difference in coverage for each band in a simulation in which only the attenuation of the walls has been taken into account:
2,4 GHz

5 Ghz
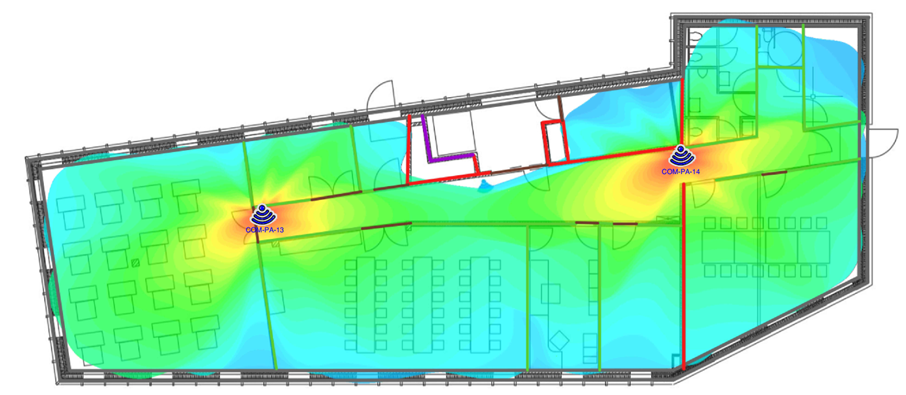
To properly interpret these results, it must be taken into account that the maximum value of this signal intensity is set to 0 dBm, that is, the closer the number is to 0 dBm, the result will be more reliable connections and higher speeds.
As can be seen in the images in the 2.4 GHz band, it is predictable that in the entire area of interest we will have signal intensity values greater than -50 dBm, while in 5 GHz there are areas where we could only have a connection with signal intensities -65dBm
The value of -65 dBm is the design limit that we suggest for the use of a given band. This consideration does not mean that if in a certain study a certain area only has an intensity of -70 dBm, we should rule out the validity of the design. It is simply necessary to analyze if the requirements of the areas with lower values require a need to provide that area with a greater signal intensity. For example, if the area with the lowest signal coincides with a meeting room where the use of several laptops and mobiles simultaneously is foreseeable.
The previous studies are carried out with predictive Wi-Fi coverage design tools that can be found commercially on the market or even with tools from the access point manufacturers themselves. To carry out the preliminary study, a plan of the installation must be started in which at least the materials that make up the different walls and party walls that are going to exist are known. On this plane we must define the attenuations caused by the different walls in the transmission of the signal. Typical attenuation values depending on the materials would be:
Material |
Attenuation |
| Dry Wall | -3 dBm |
| Brick Wall | -10 dBm |
| Concrete | -12 dBm |
| Elevator/elevator shaft | -30 dBm |
| Thin door | -2 dBm |
| Thick door | -6 dBm |
| Thin glass/window | -1 dBm |
| Thick window/glass | -3 dBm |
Once the floor plan has been established with the attenuations of the party walls, the location and orientation of the access points will have to be defined. Normally, predictive software incorporates databases of different access points of each manufacturer and takes into account the polar diagram of each model and its technical characteristics and features. But in the event that the specific model included in the software database is not found, it is always possible to use generic models that, based on the technical data of transmitted power, will allow us to evaluate the design. Likewise, it will be necessary to have the type of antenna that the access point incorporates, because if we have used unidirectional antennas or with a certain transmission angle, the behavior will not be the same as if the antenna is omnidirectional and the coverage will have to be, therefore, adapted.
It may also be interesting to have operation studies in case a certain access point fails in an installation. In this way we can have analyzed what happens in case of failure:

Finally, if in the design we have many access points where the different coverages can influence each other, it is essential to carry out a predictive interference study that allows avoiding adjacencies between the different channels to be used.
In the 2.4 GHz Wi-Fi band we have from the 2412 MHz band (channel 1) to the 2472 MHz band (channel 13), where there is a new channel every 5 MHz. Each channel spans up to 22 MHz, where they overlap each other. Yes.

In order to avoid co-channel interference, we must analyze that the frequency difference is greater than 22 MHz.

In order to avoid co-channel interference, we must analyze that the frequency difference is greater than 22 MHz.
The 5 GHz band is designed not to cause interference with each other. There are 21 channels of 20 MHz each, where in that space none overlap each other, being as follows:
- 5180 MHz (channel 36) to 5320 MHz (channel 64)
- 5,500 MHz (channel 100) to 5,700 MHz (channel 140)

We hope we have resolved your doubts about how to develop a Wi-Fi coverage study, for more information do not hesitate to contact with MICROSEGUR.


